System-driven approach
Configuration
Building a model

Before building the AD model using a system-driven approach, a user can adjust the following configuration settings:
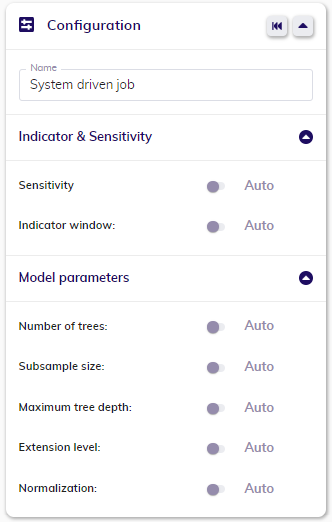
For more in-depth information about configuration, please see here.
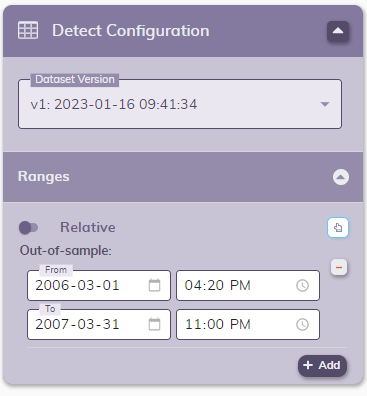
Detecting with/Iterating from a previously built model
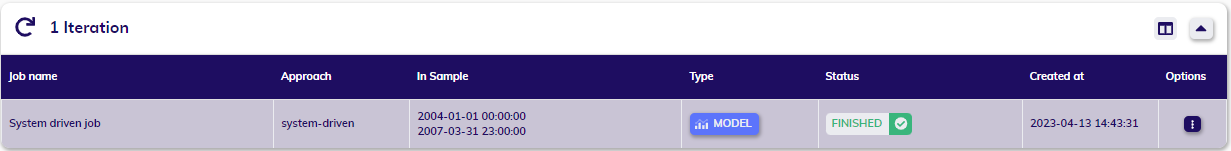
When your model is sucesfully finished, you can use it for detection or you can iterate from it to fine-tune the configuration and build a new one.

Before detecting, a user can adjust the following configuration:
When iterating, a user can adjust exactly the same as when building a model.
Results
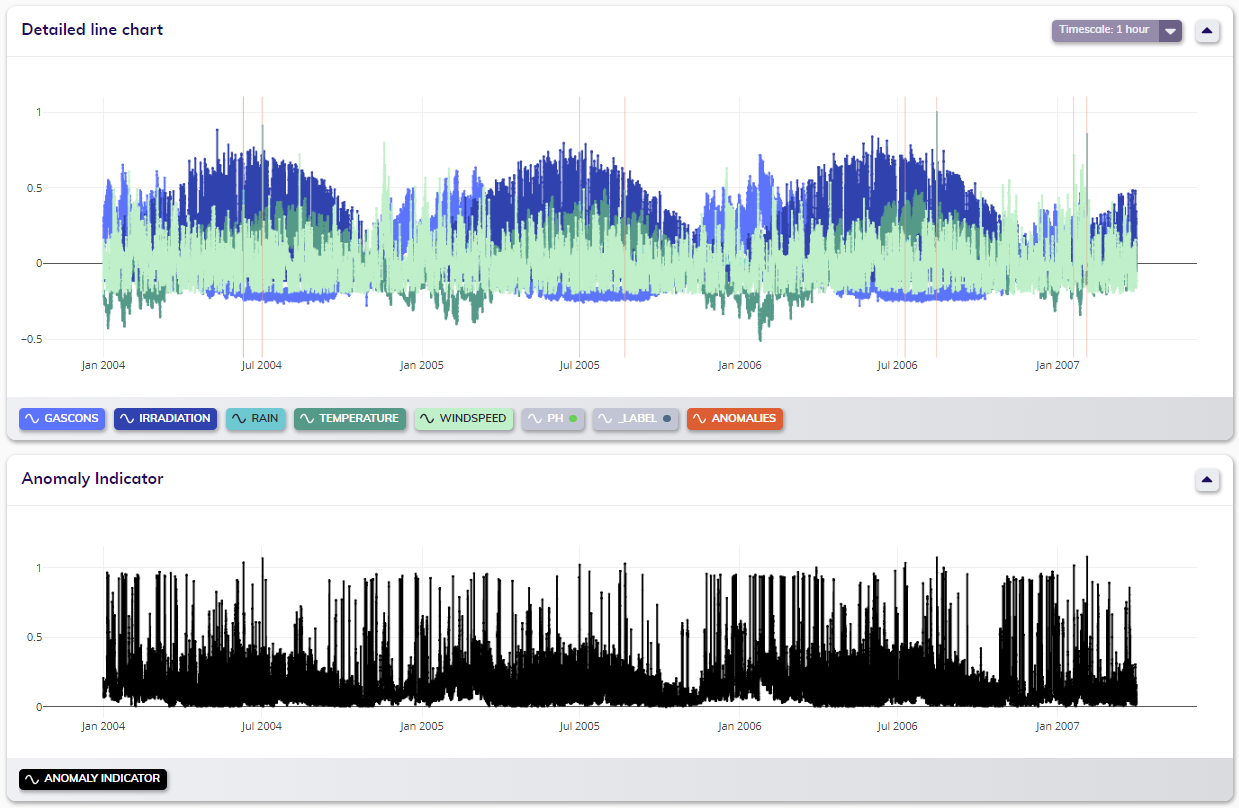
The results in the line chart(s)
Anomaly detection results consist of both anomalies and anomaly indicator. Anomalies in the Detailed line chart are linked to the anomaly indicator in the Anomaly Indicator line chart. Anomaly indicator values greater than one are flagged as anomalous points in the visualized data using orange rectangles. These results are valid for both model building and detection jobs.